Wednesday, June 24, 2020

2019-2020 Defensive Rebounding Leaders Analysis

    Welcome back! In my last article, I looked at the top 20 players in terms of offensive rebounding percentage (the percentage of available offensive rebounds a player got while he was in the game) and compared their ORB% to their offensive ratings (the number of points a player produces for every 100 possessions). If you missed the article, you can find it here. We saw that all of these players generally had very high O Ratings which were helped by their offensive rebounding. Yet, those who had the highest O Ratings generally were very good in other areas of offense as well such as shooting efficiency measured by effective field goal percentage (a modified field goal percentage where three-pointers count for more as they're worth more points).

    I felt like the next step would be to switch over to looking at defensive rebounding percentage (calculated the exact opposite of offensive rebounding percentage). You can probably already guess that I'll be comparing this to defensive ratings to see the role that defensive rebounding plays in DRtg. Defensive ratings are like offensive ratings except they're the points allowed by a player per 100 possessions. Like offensive ratings, there's a complicated formula behind them that I won't mention here. Also, they're less accurate than O Ratings because they're much more heavily influenced by how good a player's entire team is defensively. Still, it'll be interesting to look at. Like the last article, defensive rebounding percentage (DRB%) and D Rating data are from Fox Sports.

 Here's the graph comparing DRB% to D Rating:
Here's the complete list of players:
Kevin Marfo - Quinnipiac
RJ Williams - Boise State
Patrick Harding - Bryant
Dave Bell - Jacksonville
Emanuel Littles - North Alabama
Nico Carvacho - Colorado State
James Dickey - UNC Greensboro
Aaron Carver - Old Dominion
Dwight Wilson - James Madison
Austin Wiley - Auburn
James Butler - Drexel
John Mooney - Notre Dame
Nathan Knight - William & Mary
Joel Soriano - Fordham
Kai Edwards - Northern Colorado
Ahsan Asadullah - Lipscomb
Yoeli Childs - BYU
Elyjah Goss - IUPUI
Tyler Bey - Colorado
Carlos Dotson - Western Carolina

Lowest DRB%, Low DRtg

    To start off the analysis, we'll begin in the bottom left corner which is where we find the players with the lowest defensive rebounding percentage and the lowest defensive ratings. We'll focus on Tyler Bey and Joel Soriano. Even though these players have some of the lowest defensive rebounding percentages of the group, they're still only about 7% lower than the national leader, Kevin Marfo. Not too shabby. Since the lower the defensive rating is, the better (you want to allow as few points per 100 possessions as possible), let's see if other factors besides strong defensive rebounding has led to these players being such good defenders.

Tyler Bey - Colorado

    Bey is no stranger to the list of top defensive rebounders as he was second in the country last year in DRB% at 35.9%. His numbers came down a bit this season at 29.9%, but his overall defensive rating still improved. This is because Bey was able to double his steals per game from 0.8 to 1.6 and he maintained a steady 1.2 blocks per game. Another factor in the improved DRtg was that he became more disciplined in his fouling as he only averaged 2.6 fouls per game this season. Perhaps the most important factor though, was that Colorado as team got better defensively. As mentioned in the intro, a player's defensive rating is closely tied to his overall team's defensive rating. Colorado improved from allowing 97.5 points per possession in 2018-19 to allowing 94.6. Bey was well below the team average in both of these seasons, but the team improvement certainly helped him out a bit. It's clear that Bey has a strong defensive skill set beyond just rebounding as his steals, blocks, and foul discipline shows. It's no surprise that he took home the Pac-12 Defensive Player of the Year award and projects to be drafted in large part due to his defensive ability.

Joel Soriano - Fordham

    Unlike the established junior Bey, Soriano came off the bench and had fluctuating playing time for much of his freshman season for the Rams. However, he began to come into his own and started the last 11 games of the season. He only averaged 4.6 defensive boards per game, but in the limited minutes that he played this season, this translated to an excellent defensive rebounding percentage. Similarly, his block percentage was very solid (6.4%) despite him not having very many total blocks (only 0.9 per game). Offensively, Soriano struggled a bit with a 45.5% effective field goal percentage, but his efficiency improved as he experienced a larger role over those last 11 games. Soriano's excellent defensive numbers this season were largely driven by his DRB% and block% being so high in the restricted role that he had for most of the season. If he can maintain those rates and continue his better shooting efficiency while taking on more minutes this coming season, it will bode well for the team from the Bronx.

Lowest DRB%, Highest DRtg

    Now we move to the top left of the graph which is where players who had a tough time defensively, but still managed to excel on the boards appear. This would suggest that players in this region lean on defensive rebounding to make up for struggles in other defensive areas. The only player in this area to look at is IUPUI's Elyjah Goss, and we'll see what caused his DRtg to be so high.

Elyjah Goss - IUPUI

    At first glance, it's confusing to see how Goss could have such a high defensive rating. Nothing stands out as a glaring defensive weakness. He averaged 0.5 steals per game, 1.0 blocks per game, and 2.6 fouls per game. While these numbers don't necessarily wow you, they're not too far off from some of the numbers that our defensive standouts above were achieving. Thus, it's not the stats themselves that hurt Goss. Instead, it was partially the fact that he played 31.1 minutes per game for his team. His per-game stats ended up being very similar to Soriano above, but it took Soriano far less game-time to achieve them which is why he appears so much better from a DRtg standpoint. The more important factor though is that IUPUI wasn't a great defensive team last year, and we've already seen the influence of the team DRtg on an individual's rating. The Jaguars had one of the worst team defensive ratings at 111.7 points allowed per 100 possessions. Goss was actually well below this at 106.9, so while it was his worst DRtg in his three-year career thus far, we see that it certainly wasn't all his fault.

 Highest DRB%, Highest DRtg

    We're going to skip the top right corner as nobody falls within that region and we'll end this article with the bottom right. These are players who are clearly some of the best defensive rebounders in the minutes that they play and who also play solid overall defense to have such low defensive ratings. Four players could reasonably be looked at here (Bell, Harding, RJ Williams, and Marfo). I'm going to limit to the analysis today to just Bell and RJ Williams. Fear not Bryant and Texas A&M/Quinnipiac (if they don't hate him for leaving) fans, Harding and Marfo will be mentioned in a future article.

Dave Bell - Jacksonville

    Bell started his career in his home state of Ohio playing at Ohio State. After his sophomore season, he decided to take his talents down south to Florida to play for the Dolphins. He had a solid first season in the Atlantic Sun, but enjoyed a true breakthrough this past season. He experienced over a 16 point increase in his offensive rating (100.3 to 116.6) and over 9 point decrease in his defensive rating (98.4 to 89.0). As a coach, there's not much more you can ask for from your senior center. Defensively, he posted a very impressive 8.8% block rate, good for 43rd in the country. He also had 7.3 rebounds per game which is made more impressive by his high DRB%. It's a shame that Bell couldn't play another season to continue his upward trajectory. He'll certainly be a player that the Dolphins will miss next season.

RJ Williams - Boise State

    Williams came in at #2 of the players with the best defensive rebounding percentage  at 35.9%. Like Bell, he also transferred in for his final two seasons, but came from the JUCO ranks instead of another Division I program. He too experienced quite an impressive leap in both offensive and defensive ratings. His offensive rating climbed 18.6 (!) points and his defensive rating dropped by about 4 points to a nice 92.4 points allowed per 100 possessions. He actually experienced a slight decrease in both steals and blocks per game and even had an uptick in fouls per game. Thus, the improvement in DRtg seems to be driven a lot by Boise's team improvement from 2018-19's 103.3 points allowed per 100 possessions to this past season's 98.6. Williams still remained an above-average defender for his team this season and while not the focus of this article, his efficiency on offense was a tremendous help to the Broncos.

Overall Thoughts:

    Clearly, we see that individual DRtg depends far more heavily on team defensive success than ORtg relies on team offensive success. This dependency made analysis a bit more tricky as it was tough to tell how much a player's DRtg improvement was his own doing or was due to the team. Nevertheless, we got a glimpse of why Tyler Bey is becoming a frequently talked about draft prospect. We also saw a player in Soriano who looks to take on a larger role next season, and a player in Goss who will hope his team is able to get more on his level defensively. Lastly, we were able to identify two players in Dave Bell and RJ Williams who deserve recognition for really elevating their games in their final season of college hoops. 

Thanks so much for reading this far, I hope you enjoyed it!

Wednesday, June 17, 2020

2019-2020 Offensive Rebounding Leaders Analysis

    Welcome back! After spending the last article looking at skill curves and comparing usage rate to offensive rating for a few players, I decided to stick on the subject of offensive rating but with a different approach. I'll be looking players' cumulative offensive ratings for the entire season rather than on a per-game basis. As alluded to in the title, offensive rebounding will be the focus of this article, and so I'll be looking at the cumulative offensive ratings for the top 20 players in terms of offensive rebounding percentage. I decided to do this in order to see the role that offensive rebounding plays in a player's offensive rating.

    I chose to use offensive rebounding percentage instead of just each player's total offensive rebounds from the season because it adjusts for the fact that not every player has the same opportunity to get offensive boards. You'll notice that many players on this list didn't play starter's minutes, nor did they rack up a ton of total offensive rebounds. However, they took advantage of the time that they were given and dominated on the offensive glass when given the chance. I got both the offensive rebounding percentage and offensive rating data from Fox Sports. 

The following graph includes the top 22 (there was a three-way tie at 20) players in terms of offensive rebounding percentage and compares their offensive rebounding percentage to their season-long offensive rating:


As always, here's the full list of players and their schools:
Oscar Tshiebwe - West Virginia                   
Jordan Minor - Merrimack
Ed Croswell- La Salle
Kevin Marfo - Quinnipiac 
Trevion Williams - Purdue
Austin Wiley - Auburn
Scottie James - Liberty
Tyrique Jones - Xavier
Cletrell Pope - Bethune-Cookman
Patrick Harding - Bryant
Chris Harris - Houston
Freddie Gillespie - Baylor
Myles Johnson - Rutgers
Loudon Love - Wright State
Austin Phyfe - Northern Iowa
Mubarak Muhammed - Louisiana Tech
Omer Yurtseven - Georgetown
Mahamadou Diawara - Stetson
Udoka Azubuike - Kansas
Josh Mballa - Buffalo
Brison Gresham - Houston
Nate Watson - Providence

    At first glance, the graph seems very scattered and doesn't seem to tell us very much. After all, there's no clear trend such as the players with the highest offensive rebounding percentage also having the highest offensive ratings. However, if we look at the extremes (i.e. the corners), we can extract some useful information.

    For instance, the bottom right corner includes the players with some of the highest offensive rebounding percentages in this elite group, while also having some of the lowest offensive ratings. This suggests that these are players who struggle a bit in other areas of their offensive game, and their superb offensive rebounding abilities are inflating their O Rating a bit. For instance, Jordan Minor of Merrimack falls within this region. Minor, a freshman, wasn't a big part of the Warriors' strong first season in Division I having only played around 16 minutes per game off the bench. He only averaged 6.2 points and 4.4 boards per game, but his prowess on the offensive glass in the minutes that he was given helped drive his O Rating. 
    
    La Salle's Croswell also finds himself in this corner. The sophomore averaged more points (10.0) and shot a little better (60.2% eFG%) than Minor, albeit with more experience and minutes. With excellent offensive rebounding serving as a foundation, Croswell's shooting efficiency indicates that he might warrant an expanded offensive role. However, it won't be up to La Salle to provide such role anymore, as Croswell is heading to the Big East where he'll sit out a year and then suit up for Providence. This could be a really good get for the Friars.

    There's not really any players distinctly in the top right, so we'll move on to the bottom left. Of course, this is the area on the graph that you normally wouldn't want to be as it indicates the lowest offensive rebounding percentage and the lowest offensive rating. However, all of these players are the cream of the crop in offensive rebounding, and even the players in this corner have barely below a 105 O Rating which is still very solid. The two players that we'll focus on from this not so unfortunate after all section are Stetson's Mahamadou Diawara and Wright State's Loudon Love. 

    Diawara, a three star recruit, chose Stetson over offers from UMass, Rhode Island, Saint Joe's and Penn State per 247Sports. The choice seems to have paid off as he started the vast majority of the Hatters' games as a freshman and already has found himself on this elite list of offensive rebounders. The aspects that appear to be bringing down his O Rating are turnovers (3.0 per game), fouls (3.2 per game), and assists (0.7 per game). The influence of the turnovers and fouls is magnified a bit by the fact that he only played 26 minutes per game, but they should go down as he gains more experience. Getting assists up will be a little more tricky, but hopefully the coaching staff works with Diawara in getting him more involved with this aspect of the offense.

    Love's inclusion in this area surprised me a bit because he was the Horizon League Player of the Year this season. However, his O Rating was a little on the low side (at least in comparison to the rest of this group) partially because Love had his lowest eFG% (48.8%) in his career thus far. This can be explained by the fact that his usage rate was also the highest it's ever been at 31.9% as he was relied upon a ton to get the Raiders to a first place conference finish. His slight decline in shooting efficiency was countered by a nice jump in offensive rebounding percentage to help solidify himself on this list. Look for Love to be back on this list next year as he tries to end his senior season by doing the double again of  being Player of the Year and winning the league.

    Lastly, we move up to the top right. Austin Phyfe and Brison Gresham are the standouts here. This area suggests that these are players who are excellent offensive rebounders, but who also have many other offensive skills that have supported such high offensive ratings. 

    Phyfe had himself a tremendous season for Northern Iowa this year after coming back from a redshirt season due to a medical issue. He successfully made the transition from efficient sporadic starter in his freshman season to being a big piece on a great mid-major team this season. His offensive rating was 129.9 this season, good for 16th in the nation. This incredible O Rating was helped by an awesome 69.4% eFG% and Phyfe looks to be heading towards two more exciting seasons with the Panthers.

    Unlike Phyfe, Houston's Gresham didn't play a huge role on his team and only averaged 2.9 points per game. Yet the former UMass transfer made a key impact in his 15 minutes per game mostly off the bench with his offensive rebounding and blocking ability. Gresham's 1.2 blocks per game translates to 3.2 blocks per 40 minutes, which would've put him among the blocking elites this season. Aside from blocking on the defensive end, his 64.3% eFG% helped him also have such a high O Rating despite limited scoring. Teammate Chris Harris (also on this list of top offensive rebounders) is graduating and Nate Hinton, a guard lauded for his rebounding ability, is going pro which leaves the Cougars needing someone to step up. I think Gresham could be that guy.

    Overall, this graph showcased a lot of guys who I think have potential to be given a greater offensive role or who will continue to shine. I thought it was interesting too that each corner had its distinct identity of offensive player. As for my original question about what the impact of offensive rebounding percentage on O Rating is, I think its pretty clear that offensive rebounding percentage can be a big factor as all of these players excelled in this skill and none had an O Rating below 103. We saw with players like Phyfe and Gresham that a high offensive rebounding percentage provides a sort of minimum O Rating that then can be brought up to truly impressive levels with efficient shooting.


Saturday, June 13, 2020

College Basketball Skill Curves

    Welcome back! Today I decided to look at skill curves for various college basketball players. What exactly is a skill curve you might ask? Unfortunately, I can't take credit for their creation as Dean Oliver discusses them in his 2004 book Basketball on Paper. The basic concept is to compare a player's offensive performance relative to how much is demanded of him when he's on the floor. This is achieved by comparing a player's offensive rating (a complicated formula that estimates how many points a player contributes for every 100 possessions) to his usage rate (the percentage of plays that a player is involved in). In his book, Oliver creates these graphs for NBA players only, so I decided to try to extend the idea to the college game.

     For example, here's what this type of graph looks like for Marquette's Markus Howard on a per game basis. This graph as with all following graphs is fitted with a trend line with varying levels of accuracy. In Howard's graph we see the data points are quite sporadic, but the trend line is still decent. We'll see later examples where this isn't the case. Also, in Oliver's book, he determines a year-by-year average O Rating for the NBA. In the absence of a predetermined average for college basketball this past season and the current limitations with how I'm getting my data, I think a rough estimate is probably somewhere around 105.

    As you can see, as Howard's usage rate increases, his offensive rating stays relatively the same. This is pretty unexpected as you would assume that as the player is tasked with doing more for the team, his offensive performance would start to decline due to fatigue, shooting inefficiency increasing with the volume, etc. While Howard's graph doesn't show the expected decrease, it doesn't mean that we can just assume that increasing Howard's usage rate up to say 70-80% will yield the same production. However, it does confirm what many already believe to be true: he can be a very effective high-volume offensive player. 
    As mentioned earlier, this is a case where the trend line comes out looking pretty strange, and suggests that Toppin's offensive rating steadily declines until his usage rate hits somewhere around 28%, and then suddenly his offensive rating gets briefly better. This isn't necessarily true, but the trend line does show the expected decline unlike Howard's above. This suggests that coach Anthony Grant was wise not to let Toppin's usage rate creep too much above 35% to preserve Toppin's incredibly productive and efficient season. This is emphasized by the fact that Toppin only had four games with an O Rating under the estimated average of 105 and two of those games were barely under this mark.
    After looking at two star players for their respective teams, I thought that it would be good to look at a more role-player type starter. Davide Moretti came to mind because I wanted to see the impact of his decision to leave Texas Tech to go pro. He certainly was valuable to the team as he had an O Rating above 105 in over half of his games. However, we see that his optimal usage rate is less than 25%, and so it shouldn't be too difficult for Tech to bring in a replacement with similar production at this less-demanding usage rate. It's certainly easier than a team like Marquette trying to replace Markus Howard whose optimal usage rate was much higher. Another reason for Tech fans to not be too upset is the fact that we see a downward trend line. It doesn't appear that Moretti was in for a breakout senior season offensively because his offensive performance declined as he was relied upon more.

    Unlike Moretti who doesn't look like he would've seen an offensive boost this coming season, we move into bench players and see that Alex O'Connell seemingly could be ready to make such a jump. Ignoring the two huge outliers on the right, O'Connell's O Rating generally improves as his usage rate goes up and peaks around 25% which is backwards. Like Toppin and Moretti (Howard is a weird exception), we should see O'Connell's O Rating steadily decline as his usage rate goes up, but that's just not the case. My guess is that it's because whenever O'Connell's usage for a game was over 20%, he likely played a lot of garbage-time minutes where he was actually able to do things on offense and help his O Rating. Regardless of reason, I'm curious to see how he would fare consistently having a usage rate of around 30%. Unfortunately, I don't see this happening next season even in spite of his transfer to Creighton given how strong the Blue Jays project to be. The only way we might get the chance to see if this skill curve is a fluke or not is if O'Connell can't get a waiver, and after sitting out a year sees a larger role awaiting him.

    Overall, these skill curves aren't the most informative because we're limited to the roughly 30 games that each player competed in this season. Players who missed games are even more difficult to assess with these graphs. Compare this to the NBA's 82 games and skill curves clearly paint a better picture for NBA data. Another downside is that Basketball on Paper is from 2004, leaving O Rating to be a bit dated. However, I think that skill curves still have some use for college basketball in that they told us what is generally assumed such as Markus Howard being a strong offensive asset despite being relied upon so much, and also some surprising information like Alex O'Connell potentially ready to see a vastly expanded role. I think that these skill curves could be particularly valuable in finding players ready for a breakout, as well as those who should see less usage. I know that the players that I selected for this article didn't necessarily show these trends (except possibly O'Connell), so if readers have suggestions for who to analyze next, my Twitter is @cbb_statistics. 

    Thanks so much for reading if you made it this far! If you enjoyed this article, be sure to check out some of my other ones such as my one on left versus right side layup percentages!

Saturday, June 6, 2020

Left vs. Right Layup Percentages

      In my last article, I analyzed shooting volume and efficiency in the final 2 minutes for ACC players. I included all shot types for that analysis (except free throws), so three-pointers, two-point jumpers, layups, and dunks were all factored in. Today I thought it would be interesting to narrow down the shot type scope to just focus on layups. I started off by comparing the number of layup attempts from the left versus the right side to see if certain players dramatically favored a certain side. 

     I initially intended to do so with the top 20 Power 5 conference (plus Big East) guards with the most made layups. I wanted to focus specifically on guards because a guard layup generally involves more driving to the basket, and a big man layup centers more around post moves. I didn't want to have to compare these different types. Unfortunately, ESPN's shot tracking data was only deployed for certain games, and I needed this data to distinguish between layups from the left side of the basket versus the right side. There wasn't enough data for mamy of the top 20 guards with the most makes, so I resorted to looking at the top 20 players in terms of made layups with associated shot position data. This meant that I had to include both big men and guards in my top 20. Furthermore, it's evident that the shot tracking data was heavily used for games involving blue bloods, so you'll notice a lot of Duke, Kansas, Kentucky, etc. in the following list. While not what I was looking for at first, there's still some interesting insight to be drawn from this data.

Here's a more readable list of the the players with their respective teams also included:

Ashton Hagans - Kentucky
Collin Gillespie - Villanova
Davion Mitchell - Baylor
Devon Dotson - Kansas
Garrison Brooks - North Carolina
Jared Butler - Baylor
Jeremiah Robinson-Earl - Villanova
Jermaine Haley - West Virginia
Keyontae Johnson - Florida
Luka Garza - Iowa
Marcus Garrett - Kansas
Nick Richards - Kentucky
Payton Pritchard - Oregon
Tre Jones - Duke
Tyrese Maxey - Kentucky
Udoka Azubuike - Kansas
Vernon Carey Jr. - Duke
Will Richardson - Oregon
Xavier Tillman - Michigan State
Zavier Simpson - Michigan

   To reemphasize, this graph doesn't show who had the most layup attempts in the P5+BE this season, rather it shows the layup leaders for shots that actually had positioning data. Furthermore, these aren't even all of each player's layups because shot tracking data wasn't available for all of their games. Nevertheless, there's large enough samples to make at least some analysis.

    Devon Dotson, Marcus Garrett, and Vernon Carey Jr. stand out as the combined L/R volume leaders. Garrett's attempts were almost perfectly balanced at 63 from the left and 65 from the right. Dotson's 166 total layup attempts favored the right side slightly more, and we see that Vernon Carey Jr. clearly preferred the right with 79 attempts versus 59 from the left. Carey Jr. definitely had the biggest disparity between left and right, as most players were pretty balanced. We see this balance continued in the fact that there was a relatively even amount of players who preferred one side over the other. Overall, there wasn't as much disparity as I anticipated.

    Now that we discussed volume, it's time to dive deeper into just how efficient each player was on each side. First we'll start with the layup percentage from the left side:

     Florida forward Keyontae Johnson leads the way from the left having shot a blistering 28/32 (87.50%). We see him joined by fellow big men like Nick Richards (70.83%) and Xavier Tillman (71.88%) who also shot well from the left. From the guards, Collin Gillespie (65.00%) and Tyrese Maxey (70.59%) stand out. Maxey's Kentucky teammate, Ashton Hagans, struggled at 34.15% along with Baylor's Davion Mitchell (40.00%). Overall, the 20 players averaged 60.04% from the left.

Now, moving on to the right:

    Udoka Azubuike was the most efficient from the right and shot just slightly worse (84.62%) than Keyontae Johnson's 87.50% from the left. Again, we see Xavier Tillman up there with 75.00%. There weren't any major standouts from an inefficiency standpoint with Baylor's Jared Butler shooting the worst at just under 50%. Overall, the players were slightly more accurate from the right with an average of 62.32%.

    While it was interesting to look at each side in isolation, it's more useful to compare the difference between the two sides. This tells us if a player is dramatically more efficient from a specific side.
    This graph was created by taking the left-side layup shooting percentage minus the right-side percentage. Thus, players with a negative difference shoot better from the right, and those with a positive difference shoot better from the left.

    Ashton Hagans stood out in the left-side layup graph regarding how low his shooting percentage was, and this graph emphasizes how much more accurate he was from the right. Hagans' defense is what will get him drafted, but this left vs. right layup inconsistency could be something that teams look into and will be something he'll want to work at minimizing. Azubuike's left-side weakness is less of a concern because it's more of a product of how ridiculously high his right-side percentage was. Furthermore, he was a dunking machine throughout his college career which helped him lead the nation in field goal percentage this past season. A slightly below average left-side percentage (53.57%) helps illuminate just how efficient he was shooting elsewhere. The next two most significant players in terms of being better from the right are Davion Mitchell and Garrison Brooks, both of whom will be returning to school and will look to improve from the left.

    Moving to players vastly more efficient from the left, Keyontae Johnson's apparent right-side weakness is driven by his extremely high left-side percentage of 87.50% and is essentially the opposite of Azubuike in that regard. Unlike Hagans and Azubuike who are hoping to be drafted in mid-October, Johnson will be returning to Florida in the fall. This means that this disparity could be something for opponents to pay attention to in trying to force him to go right, unless they're willing to test their luck with someone who shot over 85% from the left this past season (at least from the sample we have).

    The last notable player to discuss is Iowa's Luka Garza. While the focus previously has been on players who shot much better on one side versus the other, Garza did the opposite and shot exactly the same from both sides at 66.67%. He even did so with different volumes from each side with 42 attempts coming from the left and 48 from the right. Many Hawkeye fans were angry that Garza was beat out by Obi Toppin for most of the major awards this season. Yet, he may get a shot at redemption if he chooses to come back for his senior year and will look to repeat this well above average layup efficiency from both sides en route to another dominant season. Again, these are not his total season numbers so it's very likely he didn't actually shoot this equally for the whole season, but it's still an interesting quirk from the sample we have.

    Overall, this left versus right layup analysis could've been done in a much more complete and accurate way via studying film. Of course, this method would avoid the issue of not having complete data for any of the players. Also, it's very likely that some of these layups were recorded incorrectly (such as for the wrong side) with the shot tracker data, and this questionable accuracy would've been reduced by manually compiling the data. However, this obviously would take a very long time, and so this quick and slightly more inaccurate method works well enough. This analysis showed us a little cause for concern for players with a large efficiency disparity like Hagans (and slightly less so for Azubuike) as they begin their NBA journeys. It also highlighted players such as Davion Mitchell, Garrison Brooks, and Keyontae Johnson who could really benefit with extra practice from their weaker side to avoid their inconsistencies being further exposed this coming college hoops season.

Thursday, May 28, 2020

ACC Late Game Shooting Volume and Efficiency

    After diving into why Cole Anthony couldn't save North Carolina from a disappointing season, we remain in the ACC for this next article. This time, we'll look at the conference as a whole regarding players' end of game shooting volume and efficiency. 

   We'll first look into shooting volume which I thought would be interesting because teams face a tough choice in crunch time: who do they trust with the ball to go out and win them the game? Some opt for a committee approach, whereas others almost exclusively count on a few go-to guys. The graph below focuses on the top 20 ACC players who took the highest volume of shots in the final 2 minutes of the game this past season. Free throws were excluded, so only field goal attempts count. This will give us indication of each team's end of game scoring load distribution. Also, if you count closely, there's actually 22 players represented instead of 20. This is because there was a three-way tie for 20th on the list.

Note: I used Luke Benz's ncaahoopR package in R to compile the data.
Before moving into any analysis, I made the following list to also include each player's school for more clarity:
Andrien White - Wake Forest
Brandon Childress - Wake Forest
Chris Lykes - Miami
Cole Anthony - North Carolina
Dane Goodwin - Notre Dame
David Johnson - Louisville
Elijah Hughes - Syracuse
Garrison Brooks - North Carolina
Harlond Beverly - Miami
Isaiah Wong - Miami
Jalen Cone - Virginia Tech
Jay Heath - Boston College
Jose Alvarado - Georgia Tech
Kihei Clark - Virginia
Landers Nolley II - Virginia Tech
Markell Johnson - NC State
Michael Devoe - Georgia Tech
Prentiss Hubb - Notre Dame
Tevin Mack - Clemson
Tre Jones - Duke
Trent Forrest - Florida State
Trey McGowens - Pittsburgh
   
     At first glance, Brandon Childress' total jumps out at you as he took 44 of his team's shots in the final 2 minutes, good for almost 1.5 per game. Wake Forest clearly had faith in their senior to get it done. They also trusted Andrien White, another senior, despite him only averaging 9 points per game. He joins David Johnson (6.3 ppg), Harlond Beverly (7.2 ppg), Isaiah Wong (7.7 ppg), and Jalen Cone (8.0 ppg) as players on this list averaging under 10 points per game. Clearly, these guys weren't necessarily always the top scorers for their teams. 
    
    Aside from Wake Forest, another interesting team to look at is Miami. They have three players (Chris Lykes, Harlond Beverly, and Isaiah Wong) on the list indicating that not many other players got a look besides these three guys. It's also interesting that they trusted not one, but two freshman in Beverly and Wong when it mattered most. The three player dominance contrasts with a team like Louisville who had David Johnson barely on the list, leaving plenty of clutch shot opportunities to be spread out among several other players.
    
    The above graph was good for telling us which players were entrusted to deliver in the final minutes of the game, but it doesn't tell us if they were effective in doing so. After all, shooting 50 shots at say 20% is far less valuable as 30 shots at 55%. We again turn to effective field goal percentage to help us determine efficiency. Effective field goal percentage is more telling than the traditional field goal percentage because it weighs three-pointers more heavily as they're worth more points. This is especially true in late-game moments. The graph below takes these same 22 players and compares their end of game shot volumes to their eFG% in the final 2 minutes.
    Brandon Childress stood out in the earlier graph, and he sure stands out in this one too. Despite shooting far more than his ACC compatriots, he was able to maintain an above average effective field goal percentage. While Wake Forest's season was one to forget, Childress was able to salvage something out of his senior season in Winston-Salem with his fantastic end of game efficiency. Shooting volume aside, Jay Heath and Michael Devoe stand out in the efficiency department. Heath's high percentage was driven by his 8 made three-pointers, while Devoe had a more balanced attack with 4 made three-pointers, 4 jump shots, and 4 layups. It'll be interesting to see if their respective teams take note of this trend, and give them more of the ball in the final 2 minutes next season. It seems like a smart move given that their effective field goal percentages can afford to take a hit with the increased volume and they'd still remain effective late-game players. Another thing to look out for is if the high late-game efficiency translates to better overall shooting efficiency for both players next season. Devoe already saw a 7.2% increase in eFG% between his freshman and sophomore seasons, and will look to continue the increase. Heath, a freshman, will be trying to make an efficiency jump similar to Devoe's heading into his sophomore year.
    
    In taking a step back from these highly efficient scorers and moving to the more inefficient ones, we see evidence that could partially explain why both Notre Dame and North Carolina failed to meet expectations this season. This is because they both had two players on this list shooting below 35% which isn't good enough to consistently win tight games. For North Carolina, Garrison Brooks shot 33.33% on 18 shots, and Cole Anthony was 28.30% on 23 shots. I was a bit surprised that Anthony was able to put up 23 shots given how he missed a significant portion of the season as mentioned in my last article. It really emphasizes how much North Carolina relied on him to be "the guy" and how freshman volatility hampered his efficiency and prevented that from happening more consistently. Notre Dame didn't have as disappointing of a season as North Carolina's, but they weren't in the NCAA Tournament picture like many hoped they would be. Late game inefficiency by Prentiss Hubb and Dane Goodwin certainly didn't help. Poor Goodwin ended with by far the worst effective field goal percentage out of any players on this list with 5.88%. He went 1-17 in the final 2 minutes across the season, including 0-12 on three-pointers. His 17 shots is a small sample size, and unluckiness certainly could've played a part. However, it's definitely an area for him to improve upon going into his junior season as he tries to help get Notre Dame back into the upper echelon of the league.

    While the small sample sizes from these players make definitive conclusions difficult, it gives us an indication of which players are tasked with making the big plays at the end of games and how efficient they are at this task. Down the road, I might look into these same areas for some of the other 5 major conferences and possibly for the NCAA as a whole.

Friday, May 22, 2020

Why Wasn't Cole Anthony the Savior for UNC?

    The 2019-2020 season was certainly one to forget for Tarheel fans. The team tied for last place in the ACC with a 6-14 conference record and 14-19 record overall. This was their worst season by far since 2001-2002. 
    However, it didn't always seem as though the season would turn out this way. Early on, the Tarheels picked up nice wins against Alabama and #11 Oregon in the Battle 4 Atlantis. Coming out of Thanksgiving break, they were sitting at 6-1 and tracking towards another dominant season with a nice postseason run. This promise seemingly disappeared with a blowout loss to #6 Ohio State in which the Tarheels shot 27.4% from the field and another poor offensive performance against an excellent Virginia defense. To make matters worse, leading scorer Cole Anthony suffered a knee injury before the next game against Wofford. The Tarheels proceeded to suffer an embarrassing home defeat to the Terriers and it appeared like they desperately needed Anthony back. There seemed to be a popular narrative that if the team could just tread water until Anthony came back, they could make a late-season NCAA Tournament push. Yet, when he finally returned to the court on February 1st, the team still struggled. Why wasn't he the savior that he was expected to be?

    The most basic place to start looking is at points.
    In this graph as with all following graphs, the light blue line represents North Carolina's entire team statistics, the black line is the team average, and the red line represents Anthony's solo statistics. Games 9 through 21 are specifically marked because game 9 is the last game that Anthony played in before his injury and game 21 is the first game he played in after recovering. As we can see, when healthy, Anthony played a large role in the Tarheel's scoring with above or near 25 points on several occasions. However, we also see that as a team, North Carolina's scoring didn't take a dramatic hit when Anthony was out. There was just as much scoring volatility as when Anthony played, and they scored over their season average of 72.2 points per game on several occasions. If Anthony was as crucial to this team as many made him out to be, we would expect a lot more below average scoring performances from the team. Late in the season and well after his return from injury, the Tarheels had several consecutive games where they scored above their average. However, Anthony was relatively consistent in his point totals after he came back and wasn't the sole cause for the team's scoring boost.

    While scoring wasn't affected too much by Anthony's absence, we'll next look at its impact on the team's shooting efficiency by analyzing effective field goal percentage over time. Effective field goal percentage gives an added value to three point shots because they give a team more points than a two-point field goal if made.
    Effective field goal percentage is something that the Tarheels struggled with as they finished the season shooting 46.4%, good for below 300th in the country. Anthony himself was slightly below this team average at 45.1%. We see in the graph that he had early season volatility followed by some struggles immediately after his return. Yet, he certainly flashed promise shooting well over 50% for a several game span towards the end of the season. This hot streak also coincided with 3 of North Carolina's 6 conference wins and the uptick in the team's total points scored. While he was out, his team remained right around their average with the exception of a great performance against Miami (more on that later). Since Anthony's cumulative EFG% was so close to the team's, his absence neither helped nor hindered the team's shooting efficiency for the most part. However, his enhanced efficiency for the stretch towards the end of the season certainly helped in his team being able to get a few conference wins.
   So far, it seems as though the team scored at roughly the same volume and efficiency level with and without Anthony. Did the way they scored change at all during this period without him? First, lets look at the volume of three-pointers taken.


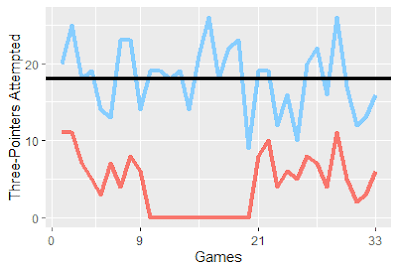
    It seems like the Tarheels tried to compensate for Anthony being out by shooting slightly more three-pointers than their average until right before and through Anthony's return. This didn't pay dividends as Brandon Robinson at 36.9% and Christian Keeling at 32% were the only other players with decent three point volumes shooting over 30%. 
    While three-pointers were definitely up a little, I expected a more profound impact to be found on team assists. This is because Anthony is certainly a scoring guard and without their alpha, I thought the Tarheels would've shared the ball more with a balanced scoring load.
    This didn't happen as dramatically as I would've thought. Yes, the team was above their season average for many of the games without Anthony (especially the aforementioned Miami game where the team played very well and got a rare win). However, we see high assist totals later on the season with Anthony back, so there isn't much of an indication that the team completely reworked the offense with him out.
    One more non-graph area to look into is adjusted offensive and defensive efficiency. These metrics measure how many points a team scores per 100 offensive possessions and gives up per 100 defensive possessions. I used Bart Torvik's website for this, and the values were adjusted for opponent quality in these same metrics. North Carolina's adjusted defensive efficiency was 98.3 over the whole season and 98.5 when Anthony was out. Hardly significant. There was a bit more disparity when it came to offensive efficiency with the season-long statistic being 108.2 which then dropped to 106.3 with Anthony injured. However, a 1.9 decrease over a small 9 game sample could very well be attributed to random variation as opposed to the loss of Anthony. Yet again, there was not a completely dramatic drop as may have been expected.
    Ultimately, the reason Anthony wasn't able to come in and rescue his struggling team is because it appears as though the team didn't play that much differently with or without him. They scored about the same number of points and with roughly the same shooting efficiency. If he truly was to be North Carolina's savior, they would've seen a much more precipitous drop in scoring and efficiency than they actually did. It seems as though they were able to break up his scoring volume across several players who cumulatively had about the same efficiency as Anthony. Thus, when he came back and resumed his role as the scoring leader, it resulted in basically the same production just now from one player as opposed to several. 
    Anthony's return wasn't entirely full of disappointment as he did have a hot streak towards the end of the season where he maintained his high scoring volume but did so at a tremendously high shooting efficiency rate. This definitely contributed to his team picking up a couple of wins, and undeniably provided value. However, his efficiency struggles immediately after returning and in the final few games averaged in with the hot streak and resulted in him not being as efficient overall after his return as was needed. He didn't need to shoot quite as efficiently as during the hot streak, but he needed closer to the 50% mark each game if he were to truly put the team on his back like some expected. Of course, this is an extremely tough ask of any player, much less a freshman scoring guard.
    Lastly, the offense surely underwent some minor tweaks to compensate for the absence of Anthony. Yet, from a broad overview, there wasn't much change as the Tarheels only shot marginally more three-pointers and didn't see a huge uptick in assists. Thus, it was impossible for Anthony to come in and be the hero that many expected him to be when his presence didn't consistently change the team from a statistical perspective.

Thursday, May 14, 2020

Timing of Turnovers for Top 10 Most Turnover Prone Players 2019-2020

Welcome to the CBB Statistics Blog! For my first article, I decided to look into when exactly the players with the highest total turnovers in the 2019-2020 season coughed up the ball the most. I used Sports Reference to get the following list of players:

1. Josh Sharkey (Samford) - 177 turnovers
2. Jomaru Brown (Eastern Kentucky) - 149 turnovers
3. Colbey Ross (Pepperdine) - 140 turnovers
4. Antoine Davis (Detroit) - 136 turnovers
5. Tajuan Agee (Iona) - 135 turnovers
6. John Crosby (Delaware State) - 129 turnovers
7. A.J. Lawson (McNeese State) -127 turnovers
8. Antonio Daye Jr. (FIU) - 125 turnovers
9 (tie). Ahmad Clark (Albany) - 123 turnovers
9 (tie). Holland Woods (Portland State) - 123 turnovers

Sharkey tops this list and had the highest number of turnovers since the 2007-2008 season which is when Sports Reference seemingly started keeping track. He edged out Ja Morant's 2018-2019 total by 7. The fact that a guy like Morant found himself on this list despite his pedigree emphasizes that many of the guys aren't on this list because they're bad players, but because they're so depended upon by their team to constantly make plays which inevitably leads to more turnovers.

To get the timing of when each turnover occurred, I used Luke Benz's ncaahoopR package in R. I wasn't able to get data for every game, but in most cases these are nearly complete samples. I then created histograms for each player and made the bins based on eight 5 minute sequences of the game (overtime was excluded). For instance, the first bin will show how many turnovers a player had with 40-35 minutes left in the game (the first 5 minutes of the first half). Without further ado, here are the results along with more information on the players and some brief analysis:
Sharkey led his team in scoring (18.0 ppg), assists (7.2 per game), and steals (2.7 per game) in his senior season. Unfortunately, his dominance in these areas did not translate to much on the court success for the Bulldogs as they finished 8th in a tough SoCon and saw head coach Scott Padgett get fired. The above histogram shows Sharkey was pretty consistent with when his turnovers occurred with an increase coming at the end of games. Given how much his team needed him, this is expected.
Brown led the Colonels with 18.4 ppg and added 2.7 assists per game. The team had a successful season finishing 4th in the Ohio Valley and making it to the conference tournament semifinals before bowing out to eventual champions, Belmont. Brown's turnover distribution is very interesting as a large portion of turnovers comes in the first 10 minutes of the game. There's also a very clear continual decrease as the first half progresses. This could be an area for opponents to exploit by applying additional pressure in the beginning of games before letting off when Brown tends to settle in. It's also likely an area that the Eastern Kentucky staff is targeting to minimize these early turnovers so the team isn't put in a hole at the beginning of games.
Following the trend of these players being high-scorers, Ross was Pepperdine's leading scorer with 20.5 ppg and assist leader with 7.2 per game. He helped Lorenzo Romar's squad have a decent season with a .500 conference record and pushing Saint Mary's to double overtime in the conference tournament. We see Ross had above average turnovers at the beginning of games, right after halftime, and at the end of games.


Son of head coach, Mike Davis, Antoine does it all for the Titans. He was 4th in the country this past year with 24.3 ppg which is actually down from his 26.1 ppg the year prior. He doesn't just score as he led the Titans in assists (4.5 per game) and steals (1.7 per game). He had slightly more turnovers than his average coming out of the half and had a pretty large increase in the final 5 minutes because he's certainly the guy who's getting the ball to close out games.

Iona had a somewhat down year struggling in their conference and without head coach Tim Cluess who later resigned due to health reasons. The Gaels would've snapped their 4 consecutive NCAA tournament berths streak even if COVID-19 hadn't shut down the season as they already lost in the MAAC quarterfinals. Finally we have a player in Agee who didn't lead his team in scoring and who is our first non-guard. However, he was still their second scoring option with 14.7 ppg while being their best rebounder (7.2 per game) and shot blocker (1.2 per game). Yet again we see a slight spike in turnovers after halftime and in the closing minutes.
As mentioned above, I had trouble getting data for certain games for every player, but I certainly had the most issues with Crosby and his Delaware State team. Thus, this isn't a very complete sample and not much should be taken away from it. Crosby brings us back to looking at guards and no surprise in that he also led his team in scoring after transferring from Dayton with 19.7 ppg and assists with 3.3 per game. The Hornets went winless against D1 foes until January 11th and struggled to a 6-26 record.
We head to the Southland conference for our next guy, A.J. Lawson of McNeese State. Lawson was behind forward Sha'markus Kennedy in scoring, but should take on more of the scoring load next year in his senior season with Kennedy having graduated. The Cowboys were gearing up to play in the Southland conference tournament following their 6th place finish before the season ended. We see a decent turnover increase after half and at the beginning of games. There's also a slight increase in the final 5 minutes, but Lawson has the lowest total turnovers in this 5 minute segment of everyone we've looked at so far (including John Crosby with his half-missing data).

Daye Jr. bucks the trend of everyone on this list being either the 1st or 2nd scorer on their teams as he had only the 4th highest ppg on a very balanced scoring FIU team. While he may have lacked in scoring, he made up for it with 4.9 assists per game and 1.8 steals, both of which were team highs. The Panthers were still in the Conference USA tournament and were looking for at least one more win to cement a second consecutive 20 win season. Daye's turnover histogram is certainly unique with slightly higher than average totals in the traditional first 5 minutes and first 5 after half, but the largest increases being at seemingly random segments. The 15-10 minute left interval seems too low to be normal, so this could be indication of a time where he gets his rest before the final stretch.


Clark was the points guy (16.7 ppg), assists guy (4.2 per game), and steals guy (1.6 per game) for the Great Danes. Unfortunately, he wasn't able to lead his team to the NCAA tournament in his final season as Albany was bounced by Stony Brook in the America East quarterfinals. Clark's turnover distribution is a fairly even one with a slight increase at the end of games. Interestingly, his ball security was best for the two 5-minute segments sandwiching halftime.
For the final player of the list, and who's actually tied with the above Ahmad Clark, is Portland State's Holland Woods. Woods was the Vikings' leader in points (17.7 ppg), assists (5.2 per game), and steals (2.1 per game). However, he won't be able to work on trimming down his turnovers for the Vikings as he'll be headed to Tempe to play for Arizona State presumably after sitting out a year. It's a disappointment for the Vikings who enjoyed a nice 4th place finish in the Big Sky. We see Woods with a huge drop in turnovers after the first 5 minutes, almost as dramatic as Eastern Kentucky's Jomaru Brown mentioned earlier. He also had an increase leading up to and after halftime, but finished it off with a rare slight decrease in the final 5 minutes compared to the previous 5 minute interval.

Overall Analysis:

While it was fun to look at these distributions, there's not too much that we can take away from them. After all, most "large" increases or decreases in turnovers between the 5 minute intervals were by about 5-7, which when distributed across a 30+ game season, become not very significant. In fact, the only really significant takeaway is how drastically different Jomaru Brown's turnover distribution was. His early game turnovers is something valuable for his own team to work on as well as for the opposition to prepare for. In addition, we saw the expected trend of total turnovers being higher than the average at the beginning of games, right after halftime, and in the closing minutes. This makes sense given that in the beginning of games, players have to adjust to the opposing defense. They also may struggle to shake off the rust after taking their halftime break and/or have to deal with any defensive adjustments by the opposition. Lastly, the ending of games is always chaotic and given these players' importance to their teams, it's a given that they'll make some mistakes with the ball being almost constantly in their hands at the end. Given that many of these players are "the guy" for their respective teams regardless of how poor they play, an interesting follow up to this analysis would be to look at the distributions for the top 10 power conference turnover leaders. These power conference teams have the depth to pull a guy who's coughing up the ball a lot early, so their distributions may be more skewed to the right.